Campaign Reporting
This knowledge base article explains Doohly’s campaign reporting features; where to find them, and how to measure your performance.
Overview
The reporting feature consolidates reporting from bookings into a campaign level, allowing you to track and report on your performance.
How To Access Reporting
To access your campaign’s reporting data, go to the “Campaigns” section on the left menu bar. You will then need to select which of your campaigns you would like to view.
Once you have chosen a campaign you will need to click on “Reporting” at the top of your screen, just below “Campaigns”.
This will direct you to your performance overview dashboard. It is here that you are able to view your performance as an “Overview”, by “Bookings”, “Creatives”, or “Devices”.
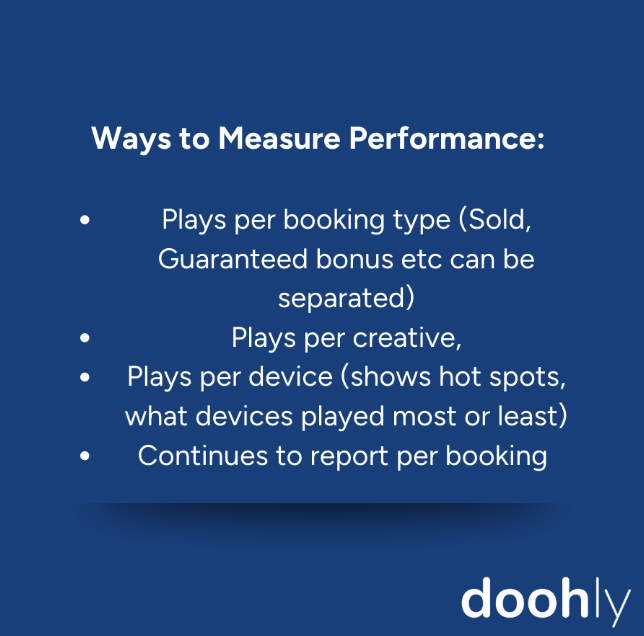
Ways to Measure Performance
Data can be broken down into different categories so that you can gain a better understanding of what is or isn’t working for your campaign.
Simply click on the category you would like to view a report for and scroll down to see the graph and table breakdown of performance.
Reporting Categories
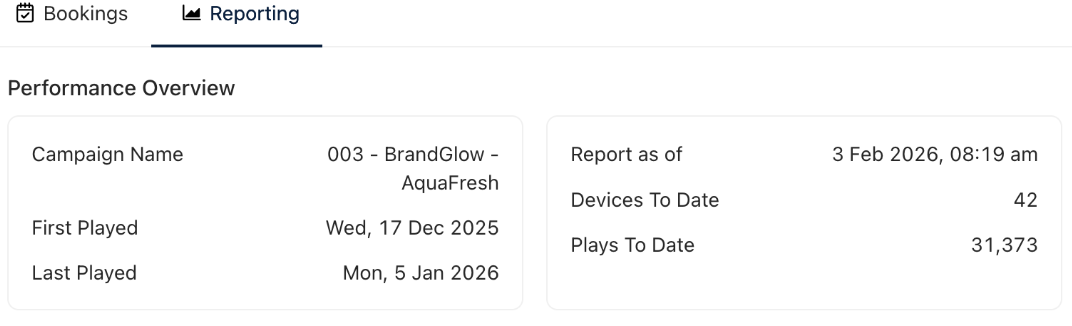
Overview
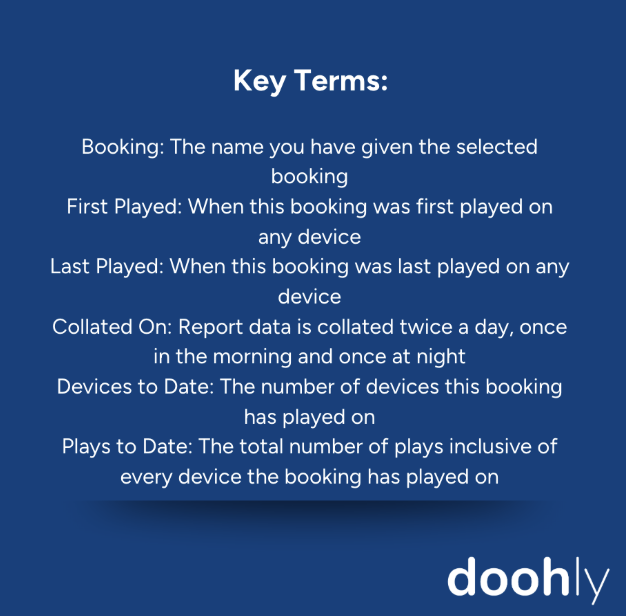
The ‘Overview’ section provides a summary of your campaign’s performance. Once you have clicked on “Reporting” it will automatically take you to the Overview section. You can click “Overview” to return to this summary if you move from this page to “Bookings”, “Creatives”, or “Devices”. Here you will see a graph of overall performance, followed by a table breakdown by day for the time period selected.
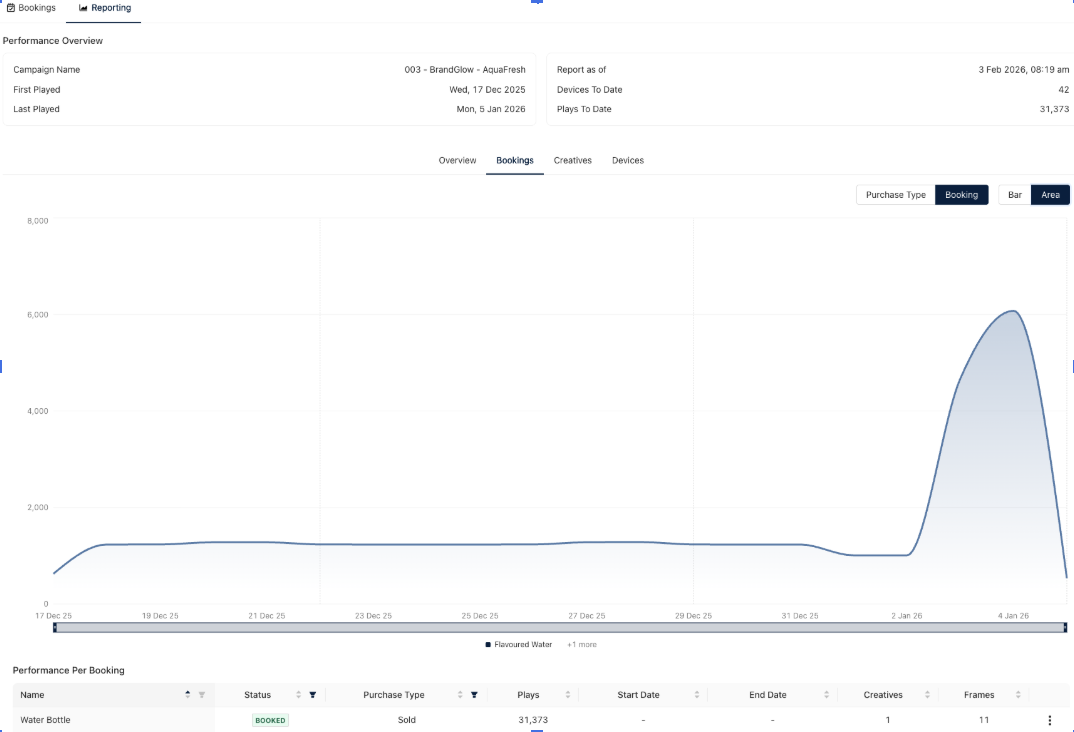
Bookings
Once you have clicked on “Bookings” you are able to categorise your data by choosing “Purchase Type” or “Booking”, and view the information as a “Bar” or “Area” chart.
To navigate these charts:
- Use the brush to scrub between certain date ranges
- Click and drag your mouse to zoom in
- Right click to zoom out
By scrolling to the bottom of the page you will also see ‘Performance Per Booking’ presented in a table format.
Creatives
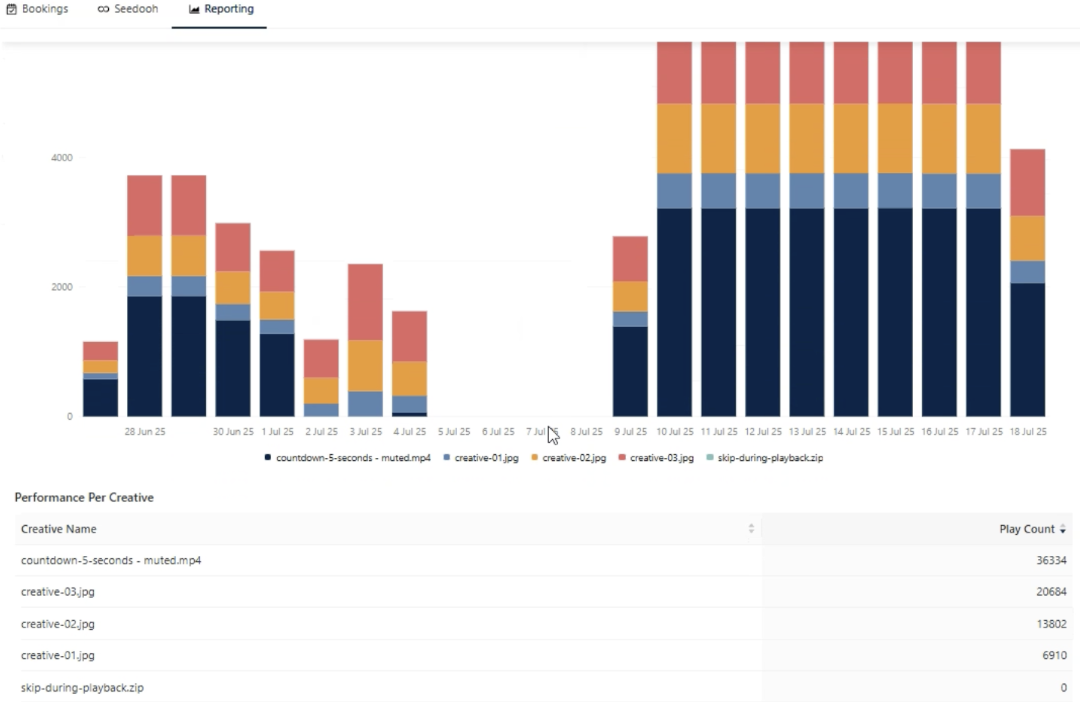
By selecting “Creatives” at the top of your ‘Reporting’ section, you will be shown a bar graph that measures ‘Play Count’ per individual creative in your campaign. A table at the bottom of the section will then show you the data by ‘Creative Name’ and corresponding ‘Play Count’.
Devices
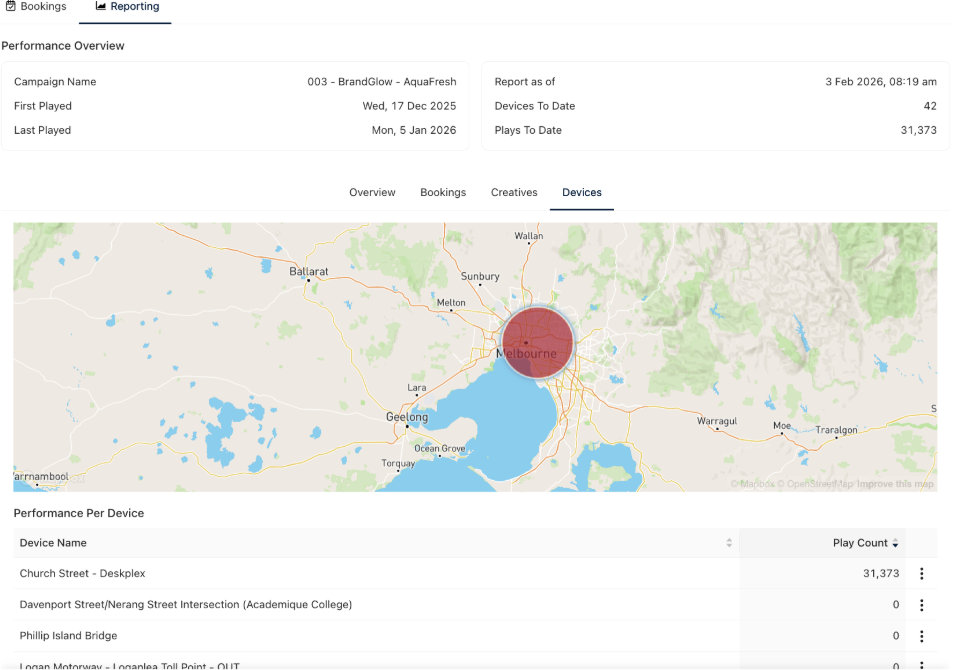
Clicking on “Devices” will take you to a map feature where you are able to track performance per device. By clicking on ‘Device Name’ on the table at the bottom of the page, the map will zoom in and show you each device location and the corresponding ‘Play Count’.
Updated 5 months ago